National Student Clearinghouse Launches New Pilot to Map Student Transcripts to Employer-Verified Skill Sets

  1. NEWS HOME
  2. »
  3. Press Releases
  4. »
  5. Page 10

National Student Clearinghouse Launches New Pilot to Map Student Transcripts to Employer-Verified Skill Sets

Education nonprofit engages data services firm AstrumU to help connect education and skills to career outcomes

HERNDON, VA – (NOVEMBER 15, 2021) – The National Student Clearinghouse and AstrumU today announced a new innovation pilot designed to help schools and learners better understand how postsecondary education transcripts and records connect to outcomes in the workforce.

Over the next year, the National Student Clearinghouse — which works with more than 3,600 colleges and universities — will evaluate AstrumU’s technology and how it can support data exchange initiatives for higher ed. The two companies have established a pilot to look for opportunities to relieve data exchange constraints and provide improved access to trusted data and insights for institutions and learners. The Clearinghouse and AstrumU expect to leverage insights from the pilot to further serve the education community to identify where machine learning can be leveraged to streamline the exchange of learner information.

“As we serve education professionals and students in an emerging era of digital credentialing, it’s critical that we discover and implement new ways to interpret and transform information to benefit institutions, learners, and industry,” said Rob Groot, managing director of learner mobility and experience at the National Student Clearinghouse. “This pilot initiative builds on our long history as a trusted, nonprofit partner in the education industry for nearly 30 years. Our aim is to develop new services with AstrumU that will unlock more value for the learners, the institutions, employers and public sector stakeholders who rely on information and Clearinghouse data for business decisions.”

AstrumU’s platform can ingest verified data directly from both schools, and employers, to understand—and predict—how specific skills, courses, and even internships or service-learning experiences translate into career outcomes. Its AI-powered recommendation engine uses predictive models to identify and recommend high-value career paths within reach for each student based on their academic and professional experiences.

“Emerging technologies such as machine learning and artificial intelligence are now making it possible to analyze and understand the connections between transcripts and credentials and their value in the labor market,” said Kaj Pederson, chief technology officer, AstrumU. “This initiative is about democratizing insight into education-to-career pathways for institutions, students, and prospective employers.”

Originally incubated at the University of Kansas, AstrumU’s suite of tools for learners, and advisors are now used by an initial cohort of colleges and universities across the country that includes the University of Kansas, the University of Washington, Pepperdine University, American University, and others.

About the National Student Clearinghouse®

The National Student Clearinghouse, a nonprofit formed in 1993, is the trusted source for and leading provider of higher education verifications and electronic education record exchanges. Besides working with nearly 3,600 postsecondary institutions, the Clearinghouse also provides thousands of high schools and districts with continuing collegiate enrollment, progression, and completion statistics on their alumni. For more details, visit studentclearinghouse.org.

About AstrumU

AstrumU translates educational experiences into economic opportunity. We are on a mission to quantify the return on education investment for learners, education providers, and employers. We help institutions measure the value created for incoming and returning students, while assisting them in securing industry partnerships that lead students seamlessly into high-demand career pathways. Institutions partner with AstrumU to drive enrollment and increase alumni and corporate engagement, while extending economic mobility opportunities inclusively to all learners.

Contact: media@studentclearinghouse.org and media@astrumu.com.

###
Undergraduate Enrollment Declines Show No Signs of Recovery From 2020

  1. NEWS HOME
  2. »
  3. Press Releases
  4. »
  5. Page 10

Undergraduate Enrollment Declines Show No Signs of Recovery From 2020

Undergrads Decline additional 3.2%

Community Colleges Drop 5.6% while Public Four-Year Colleges Fall 2.3%

HERNDON, VA(OCTOBER 26, 2021) – According to the National Student Clearinghouse Research Center, fall postsecondary enrollment numbers show no signs of recovery from last year’s declines, according to early data released today in an update to Stay Informed with the Latest Enrollment Information.

With 50.5% of institutions, representing 8.4 million students, reporting to the Clearinghouse as of September 23, undergraduate enrollment continues to decline, falling by 3.2% since fall 2020. This echoes last fall’s drop of 3.4%.

Combined with fall 2020’s declines, the number of undergraduate students has now fallen by a total of 6.5% from two years ago in fall 2019. Graduate student enrollment continued to grow, reaching 2.1% above last year’s level, for a total increase of 5.3% over two years. Overall postsecondary enrollment (undergrad and grad combined) declined by 2.3% this year, for a total two-year decline of 4.6%.

“Far from filling the hole of last year’s enrollment declines, we are still digging it deeper,” said Doug Shapiro, Executive Director, National Student Clearinghouse Research Center. “A year and a half into the COVID-19 pandemic, we continue to see significant nationwide declines in undergraduate students, and community colleges remain the most adversely affected sector, experiencing a 14.1% total enrollment decline since fall 2019.”

Undergraduate enrollment is down in all sectors, particularly among public two- and four-year colleges, and private for-profits. With a lower institutional coverage rate in this early data, however, the for-profit results should be interpreted with caution. Public two-year enrollment continued to slide (-5.6%) although not as sharply as the enrollment shock seen last fall (-9%). Public four-year enrollment, however, has fallen more this fall (-2.3% vs. -0.8% last fall) and private for-profit four-year college enrollment fell precipitously (-12.7%) in contrast to last year’s small drop (-0.3%) (see Figure 1). At primarily online institutions, undergraduate and graduate enrollments dropped by 5.4% and 13.6%, respectively, largely erasing the gains of the previous year (+8.6% last fall for both levels) (see Figure 25).

Meanwhile, undergraduates at private nonprofit four-years fared better, falling only 0.7% this fall. There was a sharp disparity within the sector, however, as the most highly selective institutions grew 4.3% to return to pre-pandemic levels (now +1.8% from two years ago). All other selectivity categories experienced further declines of 1.8% to 2.5 % from last fall. A similar divide emerged among public four-year institutions: Highly selective state flagships increased 1.0% while less selective publics fell 5.2% (see Figure 5).

Nationwide, freshman enrollment has declined 3.1% this fall. While the rate of decline is less than one-third that of the previous fall (-9.5%), it remains far from having stabilized, much less showing the level of increase that would have been required to restore the losses from 2020’s entering class. Public two-year institutions again showed the sharpest freshman enrollment declines among the three largest sectors (-6.1%). This year’s freshman class at community colleges is now 20.8% below 2019’s, while the first-year enrollment numbers at all institutions are 12.3% smaller than in 2019 (see Figure 7).

White, Black, and Native American undergraduates declined more than other racial and ethnic U.S. student groups, each falling between 4.4% and 5.1%. Latinx and Asian students fell at about half those rates (-2.4% and -2.2%, respectively, see Figure 19). Whites and Blacks also showed the largest declines among freshmen (-8.6% and -7.5%, respectively, see Figure 10).

Male and female students saw similar drops this fall in undergraduate enrollment (about -3.5%). Male enrollment declines of -3.5% were smaller than last fall’s (-6.0%), particularly at community colleges (-14.1% last fall vs. -4.7% this fall), whereas female enrollment fell more than last fall (-1.8%), most notably at public four-year colleges (+0.3% last fall vs. -2.3% this fall). Cumulatively, male enrollment decline during the pandemic is now -9.3%, four percentage points steeper than the female decline of -5.3%, over the two years from 2019 to 2021 (see Figures 2 and 18).

Undergraduate enrollment fell for every age group. Declines were steepest among 25- to 29-year-olds (-8.3%). Traditional college-age enrollment (18-24) declined across all sectors (-2.6% for age 18-20; -3.1% for age 21-24). Dual enrollment of high school students increased 0.7 percent nationally after a 3.6 percent drop last fall, but the numbers still deteriorated at community colleges (-0.2% vs. -5.3% last fall), which enroll roughly two-thirds of all dual enrollees (see Figure 17).

Bachelor’s degree-seeking students in the top three common majors (business, health care, and liberal arts) all declined this fall. Notably, students enrolled in healthcare fields have reversed their gains from last fall (+2.5% last fall vs. -3.6% this fall) (see Figure 21).

The next update to the Stay Informed with the Latest Enrollment Information research that tracks the impact of COVID-19 on postsecondary enrollments is scheduled for late November. As with all Stay Informed releases, today’s data are preliminary and subject to change as more colleges submit their data to the Clearinghouse.

About the National Student Clearinghouse® Research Center™

The National Student Clearinghouse Research Center is the research arm of the National Student Clearinghouse. The Research Center collaborates with higher education institutions, states, school districts, high schools, and educational organizations as part of a national effort to better inform education leaders and policymakers. Through accurate longitudinal data outcomes reporting, the Research Center enables better educational policy decisions leading to improved student outcomes.

The Research Center currently collects data from more than 3,600 postsecondary institutions, which represent 97% of the nation’s postsecondary enrollments in degree-granting institutions, as of fall 2019. Clearinghouse data track enrollments nationally and are not limited by institutional and state boundaries. To learn more, visit https://nscresearchcenter.org.

###

Transfer Student Disparities Grow Across Racial and Ethnic Lines During the Pandemic

  1. NEWS HOME
  2. »
  3. Press Releases
  4. »
  5. Page 10

Transfer Student Disparities Grow Across Racial and Ethnic Lines During the Pandemic

Higher education lost about 191,500 transfer students or 8.4% compared to the previous year

HERNDON, VA – (AUGUST 31, 2021) – In the 2020-21 academic year, higher education lost about 191,500 transfer students, or 8.4% compared to the previous year, according to research released today by the National Student Clearinghouse Research Center. The COVID-19: Transfer, Mobility, and Progress Academic Year 2020-21 Report, the fifth in the series, reflects the pandemic’s full-blown impact on postsecondary students.

This is the first comprehensive report to assess effects of the pandemic on student transfer during the entire academic year, in which 2.1 million undergraduate students transferred to a college other than their last enrolled institution between July 2020 and June 2021.

“The bright spot for students is the increase in upward transfer into highly selective four-year colleges and universities,” said Doug Shapiro, Executive Director, National Student Clearinghouse Research Center. “As transfers overall decline and equity gaps grow, however, this small segment alone cannot erase the larger concerns of diminished opportunity for students.”

How enrollment and transfer patterns continue to persist or diverge going into the upcoming academic year remains to be seen, but the Research Center expects as the pandemic continues, there will likely be further divergences among students and institutions, deepening the longstanding concerns over disparities in student mobility and progress.

2020-2021 Year in Review Highlights include:

  • While every pathway of transfer suffered declines, the rate of decline was not the same. Upward transfers, moving from two-year to four-year colleges, held up relatively well, with only a 1.3% decline or about 11,900 student losses. Pandemic-driven losses were more notable in the fall. In fact, upward transfers increased in spring.
  • Disparities in upward transfer mobility increased during the pandemic year. Asian and Latinx upward transfers grew (+5.9% and +1.4%, respectively), but Black and Native American upward transfers fell further than pre-pandemic decline (-6.1% and -4.1%, respectively) while White students saw a drop consistent with the pre-pandemic rate of decline (-4.4%).
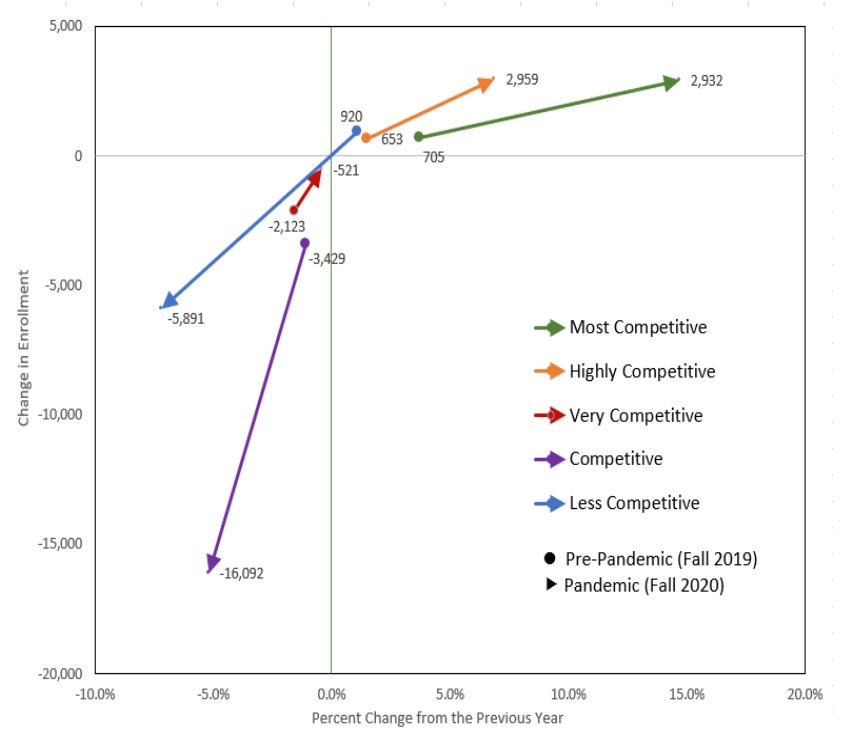
  • Only highly selective institutions expanded their total transfer enrollment for the year, thanks to an unusually large one-year growth in upward transfer (10.3%). This growth included all student groups, irrespective of gender, race, and ethnicity, or transferring within states or into different states (see the figure on the following page).
  • Patterns of upward transfer mobility along institutional selectivity, gender, and race and ethnicity shifted over the course of the academic year, most notably changing from highly selective colleges leading the growth of upward transfers in fall 2020, to marked increases in Latinx upward transfers in spring 2021 that were more concentrated at less competitive institutions.
  • As upward transfer inflows grow at highly selective colleges and a few leading primarily online institutions, their persistence post-transfer appears to be suffering. In contrast, no significant persistence rate drops attributable to the pandemic are found nationally (all transfer pathways combined).
  • Hispanic-Serving Institutions (HSIs) had substantial transfer student losses this year (-70,400 students, -11.8%), while Historically Black Colleges and Universities remained largely unaffected. Both saw post-transfer persistence rates falling due to the pandemic, except that HSIs made a small gain in the latter part of the year. Following national patterns, declines in mobility at these institutions were largely driven by men.

Year-Over-Year Change in Fall Upward Transfers by Institutional Selectivity

Note: The term “Highly Selective Institutions” refers to the top two categories combined, Most Competitive and Highly Competitive according to the Barron’s selectivity index.

By The Numbers (July 2020 – June 2021):

There were approximately 2.1 million transfer students and 11.8 million non-transfer students. Fall transfer students accounted for 64% of the total transfer enrollment for the academic year.

Transfer enrollment fell by 191,500 students or -8.4%; non-transfer enrollment fell by 456,100 students or -3.7%. The previous year, transfer enrollment had dropped 69,300 students or -2.9%.

All transfer pathways were affected but in different ways:

  • Lateral transfers fell 114,400 or -11.9% (-38,700 or -3.9% the previous year)
    • Between 2-year colleges, -83,600 or -15.2% (-27,600 or -4.8% the previous year)
    • Between 4-year colleges, -30,800 or -7.5% (-11,100 or -2.6% the previous year)
  • Reverse transfers fell 65,200 or -16.2% (-19,200 or -4.5% the previous year)
  • Upward transfers fell 11,900 or -1.3% (-11,400 or -1.2% the previous year)
    • Fall – fell by 15,500 or -2.3% (-5,800 or -0.8% the previous year)
    • Spring – increased by 2,400 or +0.9% (-8,700 or –3.2% the previous year)
  • Lateral transfers account for 60% of the total decline (44% in two-year colleges and 16% in four-year colleges); reverse transfers account for 34%; and upward transfers account for 6%.

Transfer enrollment fell more for males:

  • Males fell by 112,900 or -12.1% (-37,100 or -3.8% the previous year)
  • Females fell by 76,200 or -5.8% (-32,200 or -2.4% the previous year)

Black transfer students fell at the sharpest rate of all groups:

  • Whites declined by 86,700 or -9.1% (-59,900 or -5.9% the previous year)
  • Blacks declined by 39,500 or -12.9% (-15,400 or -4.8% the previous year)
  • Latinx declined by 31,900 or -8.4% (+3,300 or +0.9% the previous year)
  • Asians declined by 4,500 or -4.2% (-2,100 or -1.9% the previous year)
  • Native Americans declined by 1,900 or -9.9% (-1,000 or -4.9% the previous year)

The COVID-19 Transfer, Mobility, and Progress Report series, with support from Ascendium Education Group and ECMC Foundation, identifies changes in student transfer pathways that are attributable to the pandemic by using historical data as the pre-pandemic baseline and the Clearinghouse’s current enrollment data. By providing the most up-to-date information about student transfer available online for free, the Research Center enables schools, institutions, organizations, and policymakers to better adapt and serve students, particularly those from the most vulnerable populations, during the pandemic and beyond.

About the National Student Clearinghouse® Research Center™

The National Student Clearinghouse Research Center is the research arm of the National Student Clearinghouse. The Research Center collaborates with higher education institutions, states, school districts, high schools, and educational organizations as part of a national effort to better inform education leaders and policymakers. Through accurate longitudinal data outcomes reporting, the Research Center enables better educational policy decisions leading to improved student outcomes.

The Research Center analyzes the data from 3,600 postsecondary institutions, which represent 97% of the nation’s postsecondary enrollments in Title IV degree-granting institutions in the U.S., as of 2018. Clearinghouse data track enrollments nationally and are not limited by institutional and state boundaries, while maintaining the confidentiality and privacy of student records. To learn more, visit https://nscresearchcenter.org.

###

The Impact of the National Student Clearinghouse: Making a Difference in a Year Like No Other

  1. NEWS HOME
  2. »
  3. Press Releases
  4. »
  5. Page 10

The Impact of the National Student Clearinghouse: Making a Difference in a Year Like No Other

HERNDON, VA(AUGUST 3, 2021) – During the 2020-21 academic year, COVID-19 had a dramatic influence on the education community, and like many others, created the need for the National Student Clearinghouse to transition its entire operations to an online environment. This was accomplished while helping other K20 institutions meet reporting and student service obligations with minimal impact to the learner, institutions, or the federal government.

The Clearinghouse’s 2020 Annual Impact Report released today shows how learners, education institutions, public policy makers and employers benefited from our services last year:

  • 2.3 billion transactions processed saving schools hundreds of thousands of hours so they can focus on serving learners.
  • $750+ million saved by educators from our services, enabling them to deliver increased value to learners nationwide.
  • 500 million+ records queried providing clients with actionable insights about learner outcomes related to persistence, retention, and educational achievements.
  • 20 million enrollment and degree verifications performed for student service providers offering discounts and more to students, and by employers and background screeners shortening the time candidates waited and worried before receiving job offers.
  • 9.5 million errors resolved before enrollment data was transmitted to lenders, servicers, and the U.S. Department of Education, preventing millions of students from receiving erroneous delinquency and default notices.
  • 284,000 support requests resolved— all free of charge — by our Customer Care team members, who smoothly transitioned to remote work during COVID-19 and continued to serve our customers successfully.
  • Nearly 860 schools, enrolling more than 1.9 million students, can now provide their graduates with instant verification of their diplomas.
  • 180 webinars held virtually and attended by more than 8,400 education leaders.
  • 150 school districts, consortia, and high schools have been relieved of time-consuming diploma verification and can focus on other priorities.

“During the 2020-21 academic year, we all know that COVID-19 had a dramatic influence on the education community. The Clearinghouse employees, embracing our non-profit mission, rose to meet the moment and delivered with significant impact to the K20-W education, public policy, and workforce communities, when they needed it most,” said Rick Torres, President and CEO, National Student Clearinghouse.

Funders interested in supporting our efforts to strengthen the nation’s education system to better serve all learners, may contact us online.

About the National Student Clearinghouse®

The National Student Clearinghouse, a nonprofit formed in 1993, is the trusted source for and leading provider of higher education verifications and electronic education record exchanges. Besides working with nearly 3,600 postsecondary institutions, the Clearinghouse also provides thousands of high schools and districts with continuing collegiate enrollment, progression, and completion statistics on their alumni. For more details, visit studentclearinghouse.org.

###

National Student Clearinghouse and the National Student Clearinghouse Research Center Announce New Board Members

  1. NEWS HOME
  2. »
  3. Press Releases
  4. »
  5. Page 10

National Student Clearinghouse and the National Student Clearinghouse Research Center Announce New Board Members

HERNDON, VA(JULY 20, 2021) – The National Student Clearinghouse and the National Student Clearinghouse Research Center announced today new members to each of their respective Board of Directors. In addition, Dr. Anne Bryant, Executive Director Emerita, National School Boards Association, was named board chair, and Michael Collins, Vice President, Jobs for the Future and Chair of the Research Center Board, was chosen as board vice chair.

The Clearinghouse is governed by a board of directors comprised of a cross-section of the constituencies that it serves, including representatives from educational institutions, educational associations, and the education finance industry. The makeup of the Clearinghouse’s board reflects its status as a trusted, neutral, and reliable source for educational information and services.

New Clearinghouse board members:

Dr. Jack E. Daniels, III, President, Madison Area Technical College

Dr. Sharon Morrissey, Senior Vice Chancellor for Academic & Workforce Programs, Virginia Community College System

New Research Center board members:

Dr. Sharon Morrissey, Senior Vice Chancellor for Academic & Workforce Programs, Virginia Community College System

Dr. Carissa Moffat Miller, Chief Executive Officer, Council of Chief State School Officers, and current Clearinghouse Board member

Quotes:

Dr. Anne Bryant, Executive Director Emerita, National School Boards Association

For more than 28 years, the Clearinghouse has provided data and analysis for more than 3,600 colleges and universities, the U.S. Government, and the public at large. Now, as the nation faces extraordinary challenges, we welcome the opportunity to meet the new demands across the K-20 and the workforce continuum. I am honored to serve as the Chair of the Clearinghouse Board of Directors, and we welcome Dr. Daniels and Dr. Morrissey to the National Student Clearinghouse boards.

Dr. Daniels, president of Madison Area Technical College, brings a wealth of experience, leadership, and commitment to the educational attainment of students. His expertise includes strategic and master planning, Economic Development, and Community engagement.

Dr. Morrissey, Senior Vice Chancellor for the Virginia Community College system, has a vast and deep understanding of community colleges and the role they play in Workforce Development. Given the Clearinghouse’s increasing role in the workforce credentialing arena, she will contribute greatly to our strategic thinking and planning.

Rick Torres, President and CEO, National Student Clearinghouse

The Clearinghouse’s goal of data and information democratization has never been more relevant than it is today. To accomplish this end, we are accelerating the evolution of our data custodial role and information provision capacities to extend well beyond traditional education to provide a more holistic data driven view of education, skills, and workforce pathways to better directly serve lifelong learners, and institutions of learning and enterprise.

With that in mind, we enthusiastically welcome these national leaders serving the community college and technical college eco-systems in the United States. Their insights will greatly help inform how our mission of access to the most relevant data by participants in the Clearinghouse can be enhanced via further data extensions and analytical services. I look forward to their insights in support of moving the Clearinghouse’s mission forward.

Doug Shapiro, Executive Director of the Research Center

The Research Center is very grateful to Dr. Morrissey and Dr. Moffat Miller for volunteering to serve on our board. Because of their extensive experience in research and education, the Research Center will greatly benefit from their input in our efforts to help secondary and postsecondary education leaders navigate the current environment post-pandemic and beyond.

Dr. Jack E. Daniels, III, President, Madison Area Technical College

I am honored to be selected as a Board member to the National Student Clearinghouse. The Clearinghouse provides a great service to education institutions in providing accurate data that is essential in enrollment and program planning as institutions push the completion agenda at their respective colleges and universities. Providing input and guidance to this process and data analysis is extremely important and I welcome that opportunity.

Dr. Sharon Morrissey, Senior Vice Chancellor for Academic & Workforce Programs, Virginia Community College System

I look forward to representing community colleges on the Clearinghouse and Research Center Boards to support the Clearinghouse’s ongoing goal of providing disaggregated data to inform institutions about students’ increasingly complex education journeys, including credit for prior learning, stackable credentials, industry-recognized certifications, and lifelong learning.

About the National Student Clearinghouse®

The National Student Clearinghouse, a nonprofit formed in 1993, is the trusted source for and leading provider of higher education verifications and electronic education record exchanges.

The Clearinghouse serves as a single point of contact for the collection and timely exchange of accurate and comprehensive enrollment, degree, and certificate records on behalf of its more than 3,600 participating higher education institutions, which represent 98 percent of all students in public and private U.S. institutions. The Clearinghouse also provides thousands of high schools and districts with continuing collegiate enrollment, progression, and completion statistics on their alumni.

Through its verification, electronic exchange, and reporting services, the Clearinghouse saves the education community cumulatively over $750 million annually. Most Clearinghouse services are provided to colleges and universities at little or no charge, including enhanced transcript and research services, enabling institutions to redistribute limited staff and budget resources to more important student service efforts. Clearinghouse services are designed to facilitate an institution’s compliance with the Family Educational Rights and Privacy Act, The Higher Education Act, and other applicable laws. The Clearinghouse has signed the Student Privacy Pledge and is the first recipient of ikeepsafe.org’s FERPA compliance badge, which was awarded to its StudentTracker for High Schools service.

For more information, visit www.studentclearinghouse.org.

###

College Persistence Rate Drops An Unprecedented 2 Percentage Points

  1. NEWS HOME
  2. »
  3. Press Releases
  4. »
  5. Page 10

College Persistence Rate Drops An Unprecedented 2 Percentage Points

Of 2.6 Million First-Time Freshmen, 74% Returned for Their Second Year

HERNDON, VA(JULY 8, 2021) – The National Student Clearinghouse Research Center reported today that of the 2.6 million students who entered college as first-time freshmen in fall 2019, 74 percent returned to college for their second year. This rate represents a pandemic-related, unprecedented one-year drop of two percentage points in this important early student success indicator.

“We can now add increased attrition of 2019 freshmen to the severe impacts of the pandemic,” said Doug Shapiro, Executive Director of the National Student Clearinghouse Research Center. “These losses erase recent improvements that colleges have made in keeping learners on track early. They will ripple through higher education for years.”

Highlights from the 2021 Persistence and Retention Report include:

  • There was a marked decline in first-year persistence rate in fall 2020 after remaining stable for the past four years. The overall persistence rate dropped two percentage points to 73.9 percent for fall 2019 beginning college students, its lowest level since 2012.
  • Community colleges showed the steepest persistence rate decline over last year of all institution sectors (down 3.5 percentage points to 58.5%).
  • The persistence rate gaps by race and ethnicity in the 2019 cohort remain as wide as in the previous cohort years, with approximately a 22-percentage point gap between the highest (86.5% for Asian students) and the lowest (64.9% for Black students). White (79.3%) and Latinx (68.6%) students reflect a gap of nearly 11 percentage points. The overall first-year persistence rate fell the most among Latinx students (down 3.2 percentage points from 71.8% to 68.6%).
  • Retention rates declined the most in the community college sector (down 2.1 percentage points to 51.6%) whereas the rates went up in the public four-year college sector (up 0.7 percentage points to 76.3%).
  • Freshmen transferring out in their first year dropped somewhat more than those remaining at their starting institution (-1.2 percentage points vs. -0.7 percentage points). This pattern reflects constrained student mobility during the pandemic as documented in our COVID-19 transfer report.
  • Bachelor’s degree-seeking students in liberal arts majors had the largest persistence rate drop (down 1.6 percentage points to 88.1%). But biological and biomedical sciences and health care majors increased 1.4 and 1.8 percentage points to 82.3 and 78.9 percent, respectively, in their retention rates.

The Persistence and Retention report series examines first-year persistence and retention rates for beginning postsecondary students. Persistence rate is measured by the percentage of students who return to college at any institution for their second year, while retention rate is by the percentage of students who return to the same institution. Students attaining a credential in their first year are accounted for in persistence and retention rates.

The report is designed to help institutions understand trends and patterns in this important early success indicator, and identify disparities by institutional type, state, degree level, starting enrollment intensity, major field, and student demographic characteristics such as age, gender, and race and ethnicity.

About the National Student Clearinghouse® Research Center™

The National Student Clearinghouse Research Center is the research arm of the National Student Clearinghouse. The Research Center collaborates with higher education institutions, states, school districts, high schools, and educational organizations as part of a national effort to better inform education leaders and policymakers. Through accurate longitudinal data outcomes reporting, the Research Center enables better educational policy decisions leading to improved student outcomes.

The Research Center currently collects data from more than 3,600 postsecondary institutions, which represent 97 percent of the nation’s postsecondary enrollments in degree-granting institutions, as of fall 2019. Clearinghouse data track enrollments nationally and are not limited by institutional and state boundaries. To learn more, visit https://nscresearchcenter.org.

###

Subscribe to get the latest news from the Clearinghouse