- BLOG HOME
- »
- Snapshot Reports
- »
- National College Completion Progress Rate Stalls

National College Completion Progress Rate Stalls
2016 Cohort Completion Rate of 62.3% Similar to Last Year’s of 62.2%
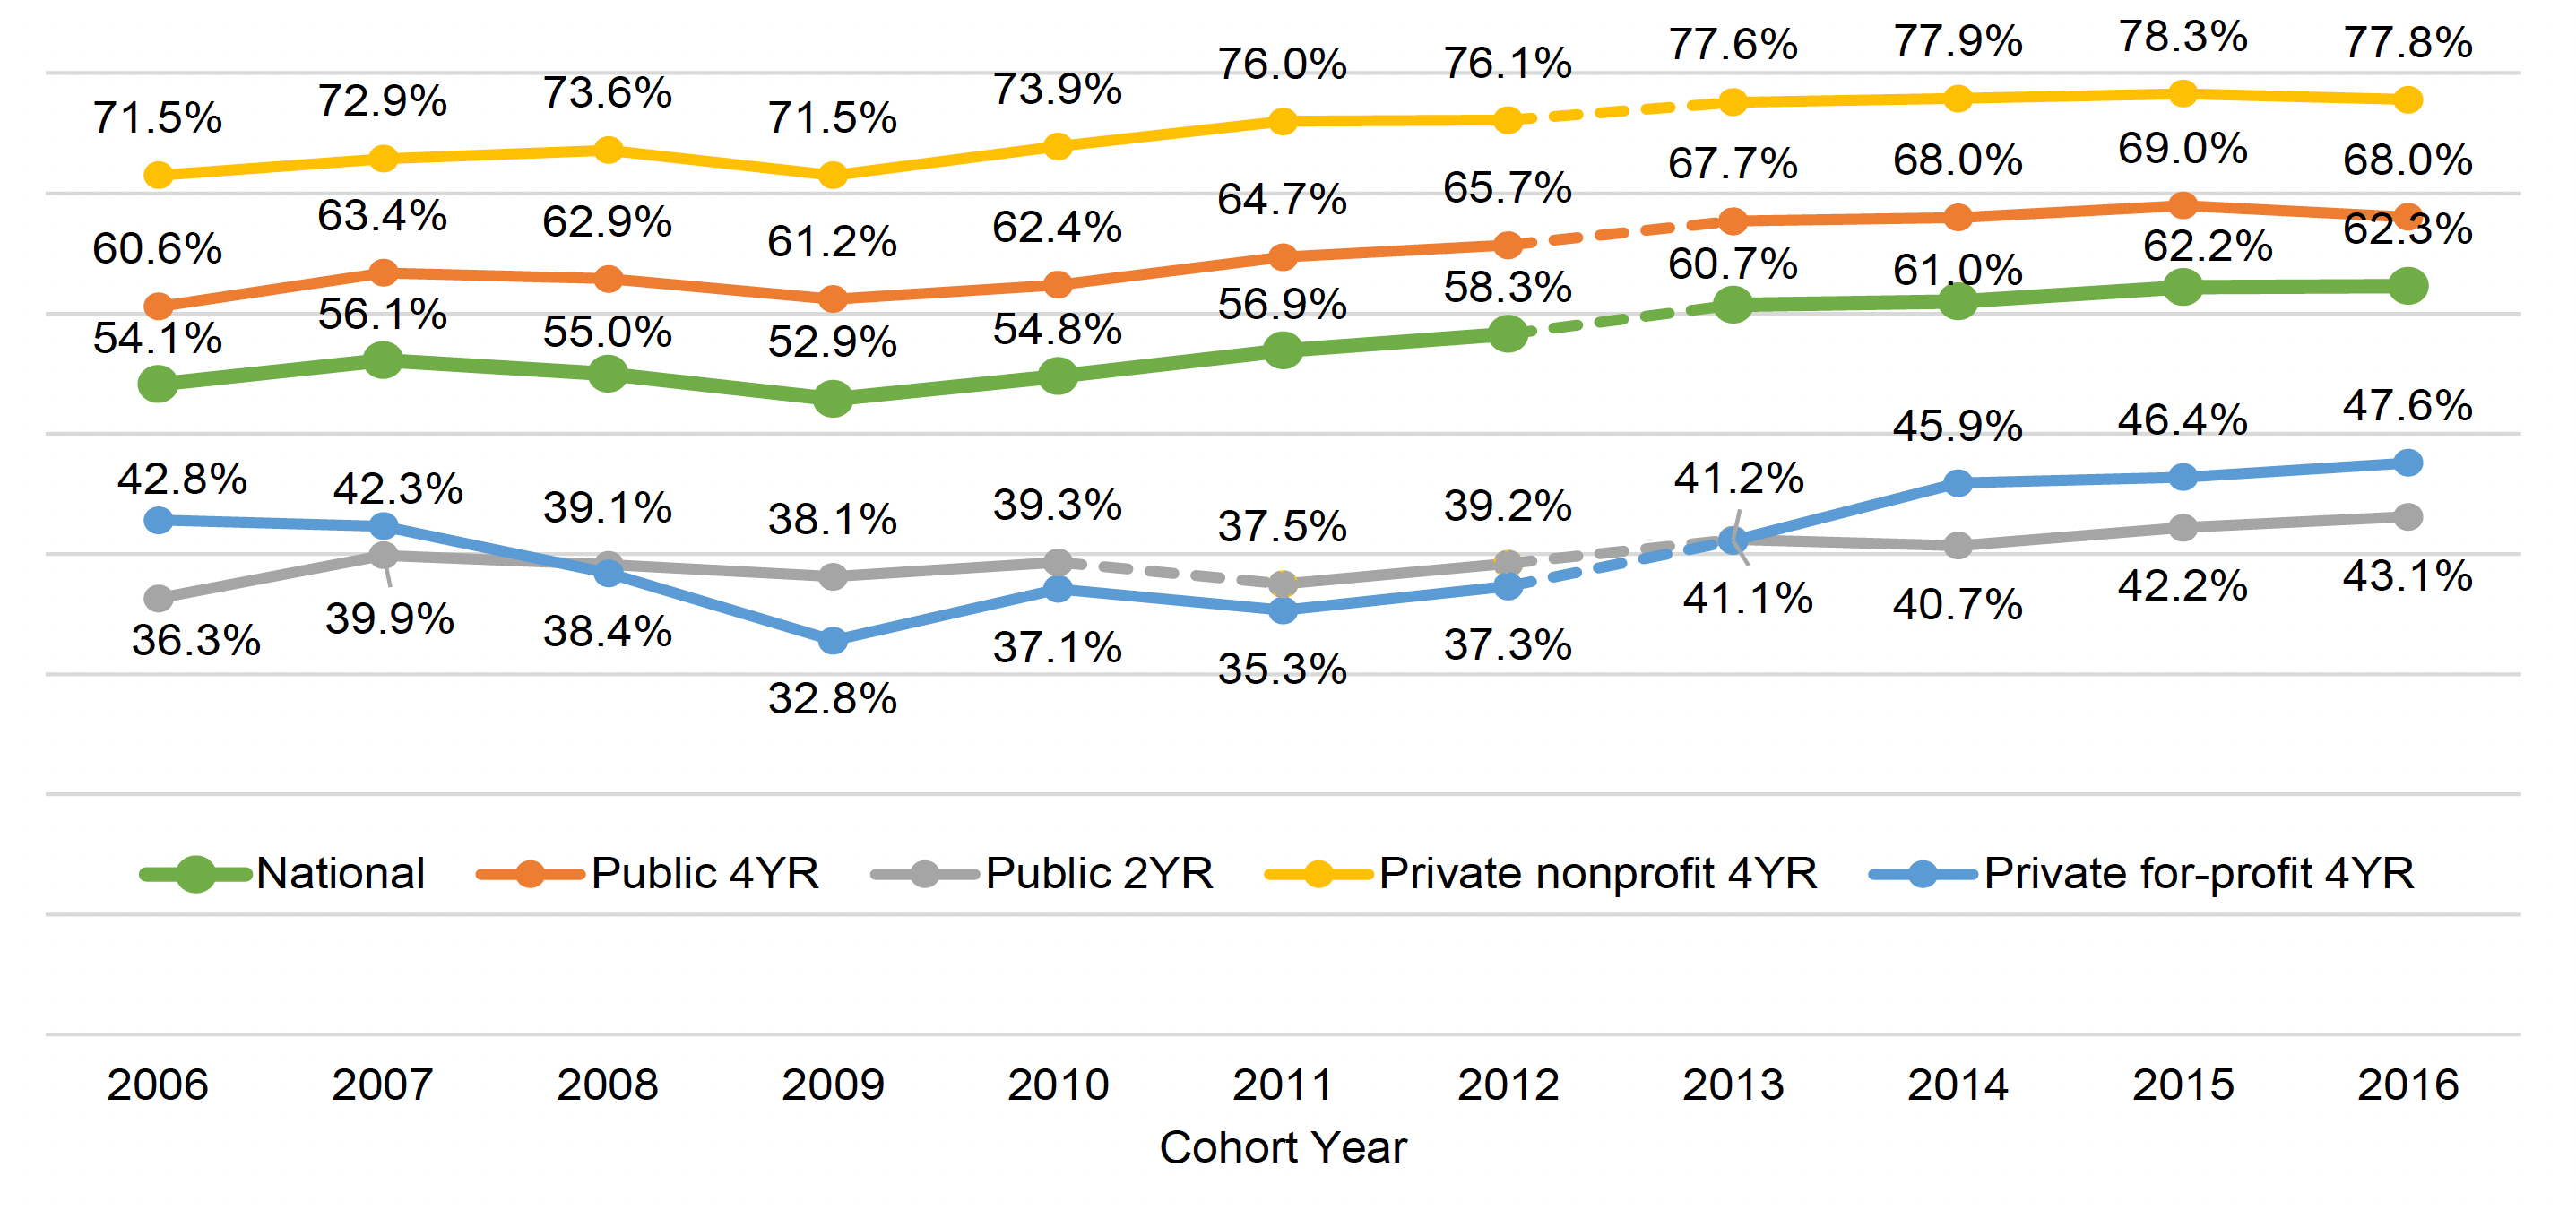
Progress in the national college completion rate stalls, according to the latest Completing College report by the National Student Clearinghouse Research Center. The latest completion rate of 62.3% is essentially unchanged from last year’s rate of 62.2%. This follows a 1.2 percentage point improvement over the year earlier.
More than 2.4 million people entered postsecondary education for the first time fall 2016, an increase of 1.4% or 33,000 students, over the previous cohort. Meanwhile, community college completion rates increased 0.9 percentage points to 43.1%, while their cohort size continued to shrink. However, for the first time in recent years, the six-year completion rates dropped among public four-year and private, nonprofit four-year starters (-1.0 percentage points to 68% and -0.5 percentage points to 77.8%, respectively), while the size of these cohorts increased.
States are slow to improve, with only five states increasing at least one percentage point. This is a shift from last year when two-thirds of states made at least one percentage point rate gains.
“Today, out of all students who started college six years ago, 37.7% have yet to complete any degree or credential,” said Doug Shapiro, Executive Director, National Student Clearinghouse Research Center. “And with only 8.9% still working on it, the remaining 28.8% amounts to too many who are short of their dreams and left out of the educated workforce of the future.”
Other key highlights include:
- Six-year completion rates increased in more than half of states, but improvements were small, with only five states increasing one percentage point or more. This is markedly different from the previous year when two-thirds of states had gains of at least one percentage point.
- Completion rates decreased at similar rates for White, Black, and Latinx students, by approximately half a percentage point, but increased for Asian and Native American students (+1.2 percentage points and +3.0 percentage points respectively).
- The gender gap in completion rates is steadily growing and is the widest seen since 2008 (7.1 percentage points).
- Traditional-aged college students beginning in fall 2016 saw no change in their overall six-year completion rate. Completion rates continue to improve for older students. Older students continue to make gains but still lag traditional-aged students.
- The national eight-year completion rates did not change between the fall 2013 and fall 2014 cohorts. An additional 4.5% of fall 2013 cohort and 4.2% of the fall 2014 cohort completed in their seventh and eighth years. Compared to other students, proportionally more Latinx and Asian students completed during their seventh and eighth years.
This is the eleventh report in the Completing College report series, featuring the completion rate trends nationally and for states, updated with the fall 2016 entering cohort’s six-year outcomes tracked through June 2022, as well as the fall 2013 and 2014 entering cohorts’ outcomes eight years after enrolling.
The longitudinal data dashboards offer six-year and eight-year national and cross-state comparisons through interactive visualizations and analysis tools. In addition, underlying data are also available for downloading.
Six-Year Completion Rates by Starting Institution Type: 2006-2016 Entering Cohort

“Today, out of all students who started college six years ago, 37.7% have yet to complete any degree or credential.”
Doug Shapiro
Executive Director, National Student Clearinghouse Research Center
Additional Resources:


